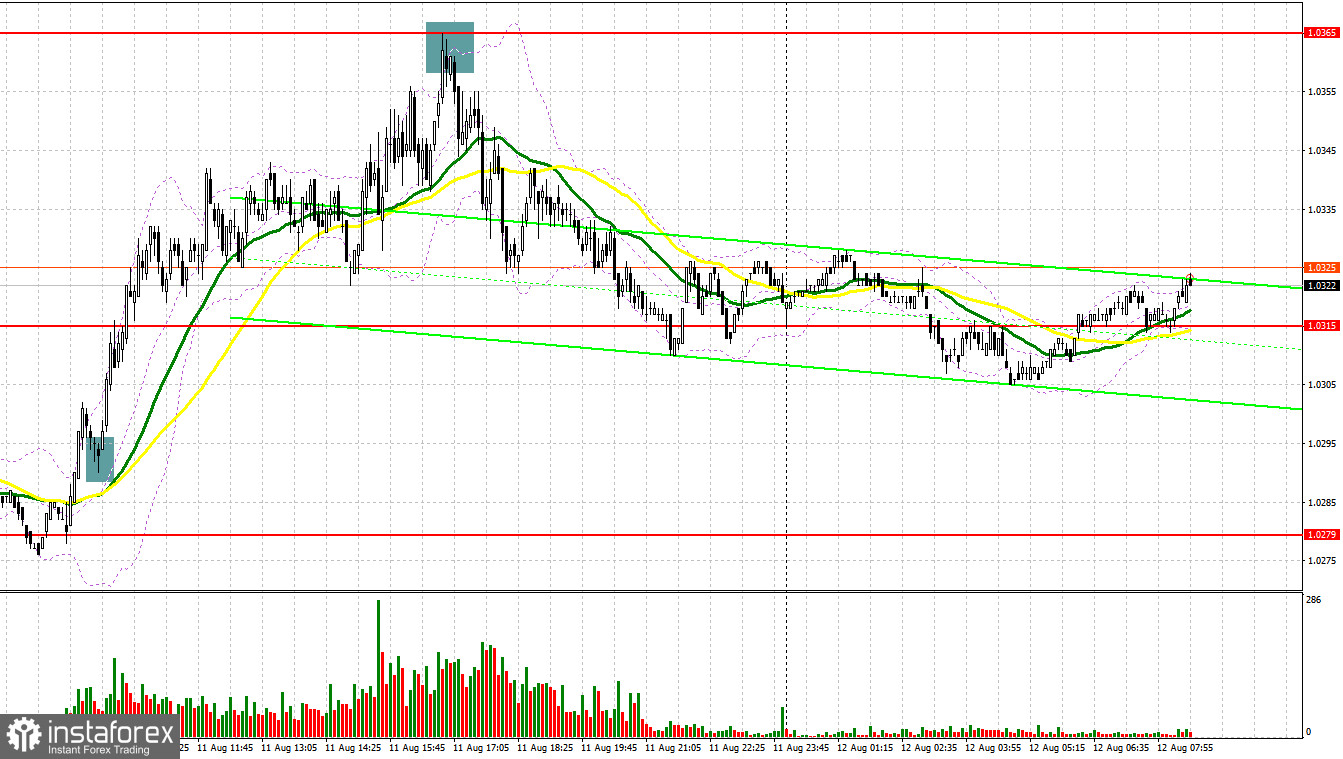
Yesterday, traders received several interesting signals to enter the market. Let us take a look at the 5-minute chart to clear up the market situation. Earlier, I asked you to pay attention to the level of 1.0292 to decide when to enter the market. A decline to 1.0292 and a false breakout of this level led to a perfect buy signal. As a result, the pair added more than 40 pips. In the second part of the day, the technical picture was absolutely different. A new buy signal was formed only after an unsuccessful attempt to climb above 1.0365. This resulted in a drop of more than 50 pips.
Conditions for opening long positions on EUR/USD:
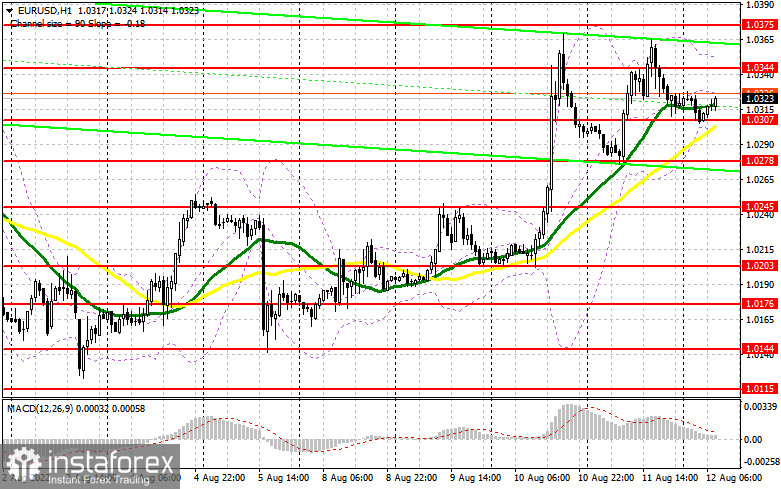
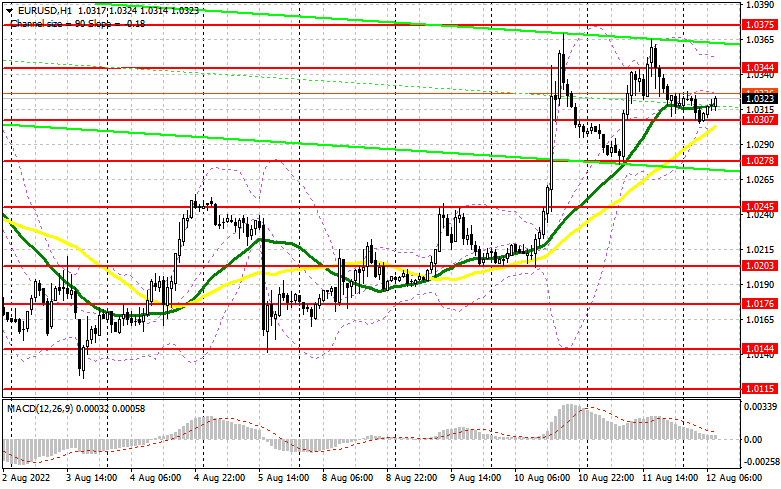
A drop in the US producer prices boosted the euro/dollar pair. It was quite predictable since data allowed traders to focus on underestimated risk assets. Expectations of a slower key interest rate hike by the Fed are becoming stronger. Meanwhile, demand for the euro is also mounting. Today's market situation is likely to favor sellers. Yesterday, it became obvious that the pair would hardly reach the local high this week. Today, in the first part of the day, the eurozone is going to disclose its industrial production data for June. The indicator may decrease, thus affecting buyers' orders and returning pressure on the euro. In this case, the pair will trade sideways again. If the euro/dollar pair declines to the nearest support level of 1.0307, only a false breakout will give the first buy signal with the target at 1.0344. A breakout and a downward test of this level will give an additional long signal with the target at 1.0375. It will be quite difficult to go above this level. If the euro/dollar pair drops and buyers fail to protect 1.0307, pressure on the pair will increase a bit. This may push the price towards the next support level of 1.0245, where it is recommended to lock in profits. It is also possible to buy the asset just after a bounce off 1.0203 or lower – from 1.0176, expecting a correction of 30-35 pips within the day.
Conditions for opening short positions on EUR/USD:
Today, sellers should primarily protect the resistance level of 1.0344, which was formed yesterday. Weak data from the eurozone will help them to do so. That is why a false breakout of this level will give a perfect sell signal. However, traders should also take control over the nearest support level of 1.0307. There are moving averages slightly below this level. A breakout and settlement below this level as well as an upward test will give an additional sell signal that may affect buyers' stop orders. In this case, the pair may slide to 1.0278. However, sellers are unlikely to gain control over this level without the help of the US statistical reports. If the price settles below 1.0278, it will surely tumble to 1.0245, where it is recommended to lock in profits. The next target is located at 1.0203. If the euro/dollar pair increases during the European session and bears fail to protect 1.0344, bulls will prevail in the market. Under these conditions, it will be better to avoid sell orders until the price hits a new local high of 1.0375. A false breakout of this level will give a new sell signal. It is also possible to go short after a rebound from the high of 1.0402, or even higher – from 1.0433, expecting a decrease of 30-35 pips.
COT report
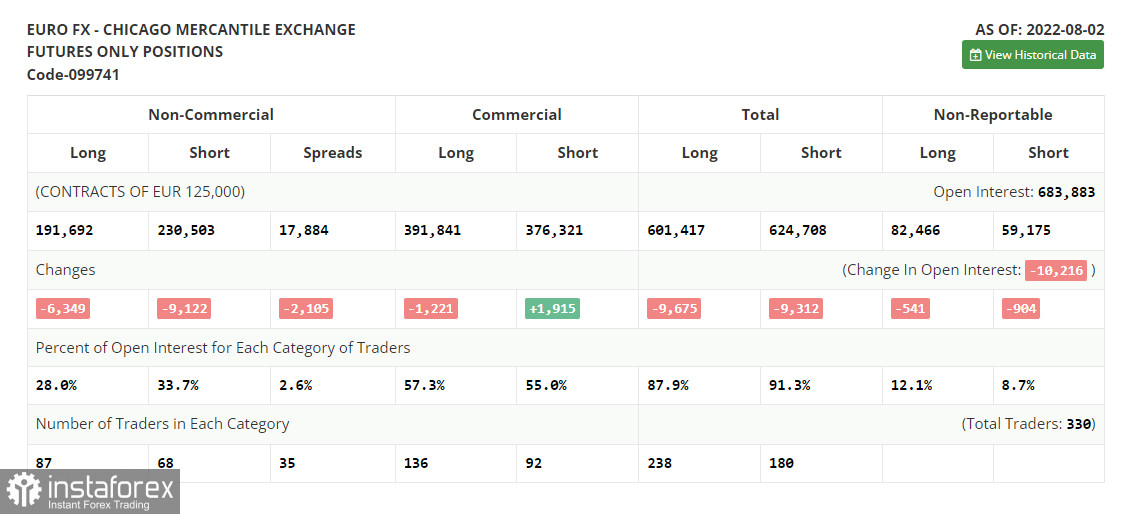
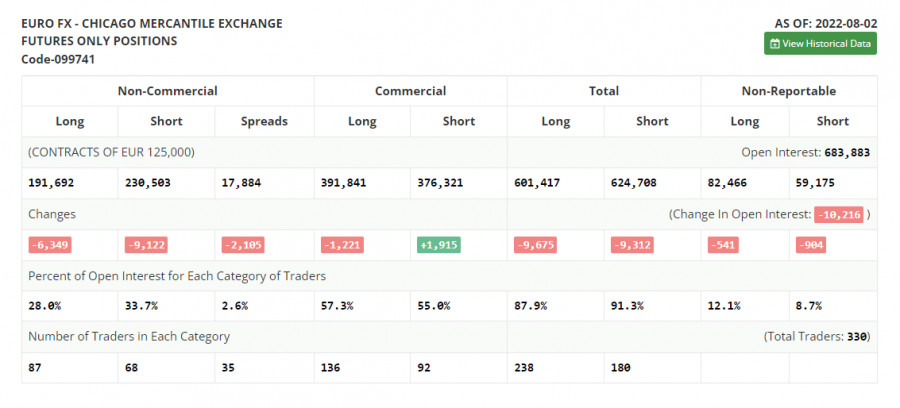
According to the COT report from August 2, the number of both short and long positions slumped. However, there was a bigger decline in the number of short positions. It reflects the gradual end of the bear market and an attempt to find the bottom after reaching the parity level. Last week, the economic calendar for the eurozone was almost empty. The US, on the contrary, unveiled many economic reports. The Nonfarm Payrolls report was quite positive. The strong labor market has once again shown the resilience of the US economy despite high inflation, recession risks, and aggressive rate hikes. A drop in long and short positions may be associated with a seasonal factor. In August, the market activity could become even lower. It is hardly surprising. The US will soon publish its inflation report. Traders will find out whether aggressive monetary tightening has helped the economy or not. If inflation starts to decline, it will be appropriate to open long positions on risky assets. The COT report revealed that the number of long non-commercial positions decreased by 6,349 to 191,692, while the number of short non-commercial positions contracted by 9,122 to 230,503. At the end of the week, the total non-commercial net position, although it remained negative, rose slightly to -39,811 from -41,584, which indicates the continuation of the bullish market. The weekly closing price increased to 1.0206 from 1.0161.
Signals of indicators:
Moving Averages
Trading is performed above 30- and 50-day moving averages, thus pointing to the ongoing rise in the euro.
Note: The period and prices of moving averages are considered by the author on the one-hour chart that differs from the general definition of the classic daily moving averages on the daily chart.
Bollinger Bands
If the pair declines, the support level will be located at the lower limit of the indicator - at 1.0295. In case of a rise, the upper limit of the indicator located at 1.0350 will act as resistance.
Description of indicators
- Moving average (moving average, determines the current trend by smoothing volatility and noise). The period is 50. It is marked in yellow on the chart.
- Moving average (moving average, determines the current trend by smoothing volatility and noise). The period is 30. It is marked in green on the graph.
- MACD indicator (Moving Average Convergence/Divergence - convergence/divergence of moving averages). A fast EMA period is 12. A slow EMA period is 26. The SMA period is 9.
- Bollinger Bands. The period is 20.
- Non-profit speculative traders are individual traders, hedge funds, and large institutions that use the futures market for speculative purposes and meet certain requirements.
- Long non-commercial positions are a total number of long positions opened by non-commercial traders.
- Short non-commercial positions are a total number of short positions opened by non-commercial traders.
- The total non-commercial net position is a difference in the number of short and long positions opened by non-commercial traders.